OriV-Finder provides users with multi-dimensional data analysis and presentation tools across four key sections.
- Whole-sequence visualization: users can intuitively examine the relationship between GC content variation and the positions of replication initiation proteins and replication origins through the whole-genome GC disparity curve and K-mer cumulative score plot.
- Replication origin visualization: the replication initiation origin visualization module combines GC profile curves and sequence schematics to accurately display the distribution of AT-rich and GC-rich regions, as well as motifs related to replication initiation.
- Replication initiation protein information: the detailed replication initiation protein information module offers protein alignment results and conserved domain features, enabling users to gain a deeper understanding of the function and classification of replication initiation proteins.
- Integrated SeqViz: the integrated SeqViz module provides circular and linear plasmid visualizations, incorporating information on replication initiation proteins, replication origins, conserved sites, and related RNARNAs, assisting researchers in efficiently analyzing the distribution of the plasmid replication initiation system.
Sample result 1 (ColE1)
View Result
Sample result 2 (pRP4_IncP)
View Result
Sample result 3 (pSC101)
View Result
Sample result 4 (R1)
View Result
Sample result 5 (pQEL231_IncQ)
View Result
Sample result 6 (pSU1_RCR)
View Result
Sample result 7 (Ti)
View Result
Sample result 8 (NO RIP)
View Result
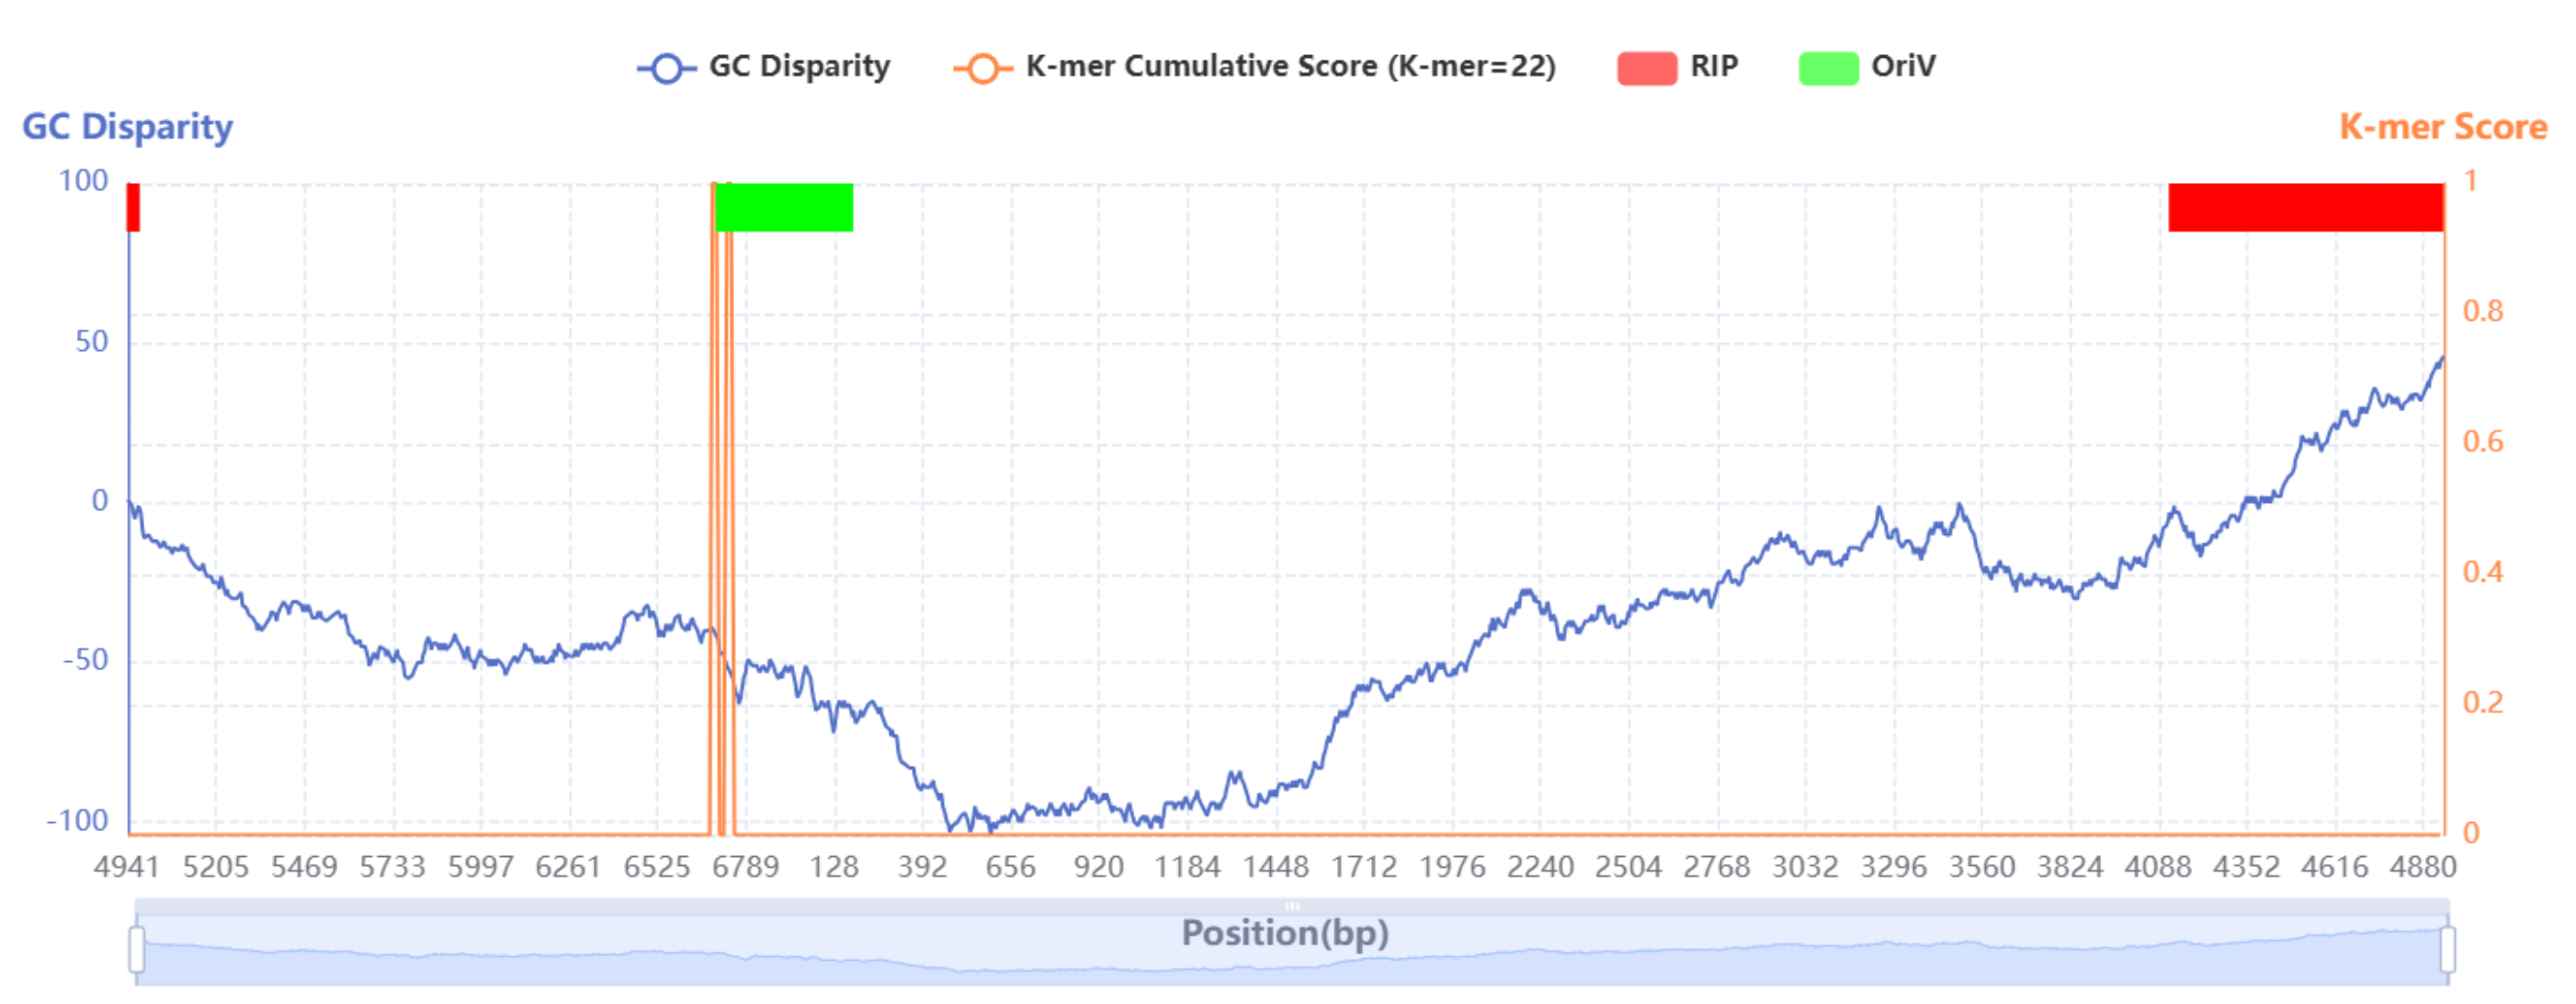
1. Whole-sequence visualization
The whole-sequence visualization image is started at the point of maximum GC disparity. The image includes the GC disparity curve and the K-mer cumulative score graph, and marks the locations of replication origin proteins and replication origins with red and green rectangles, respectively. Users can zoom in and out of the image by scrolling the mouse wheel or select and view specific datasets of interest by clicking on the legend above.
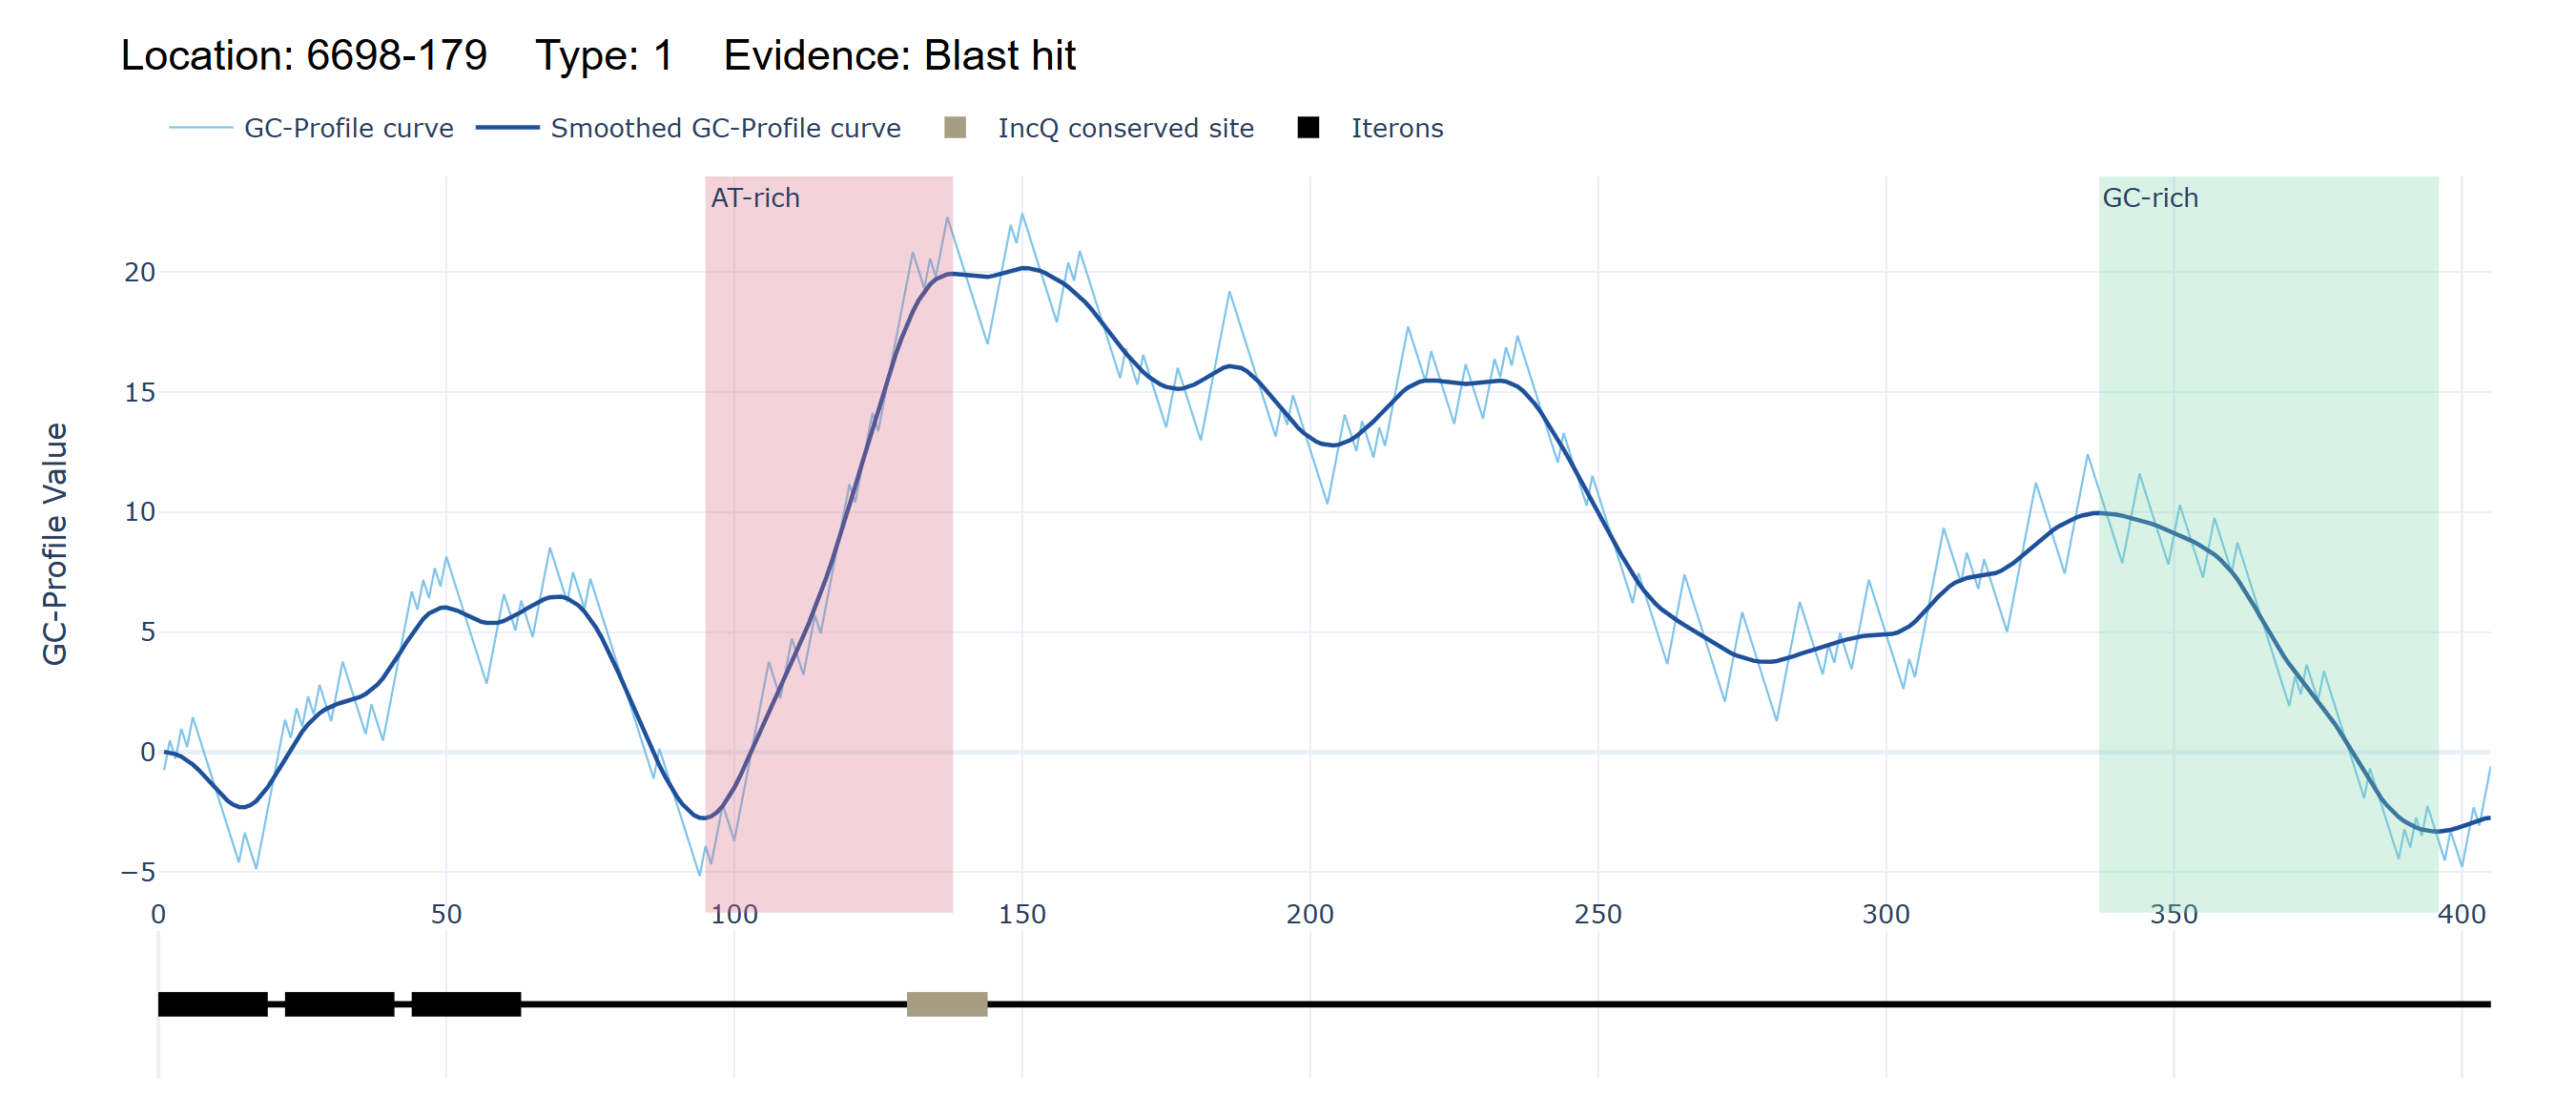
2. Replication origin visualization
The replication origin visualization module further displays the locations, level, and supporting evidence of replication origins through both Z’ curve and smoothed Z’ curve, with AT-rich and GC-rich regions marked in pink and green, respectively. This module also includes a sequence schematic that illustrates the distribution of motifs and potential iterons or RNA primers, providing a comprehensive overview of the replication initiation landscape.
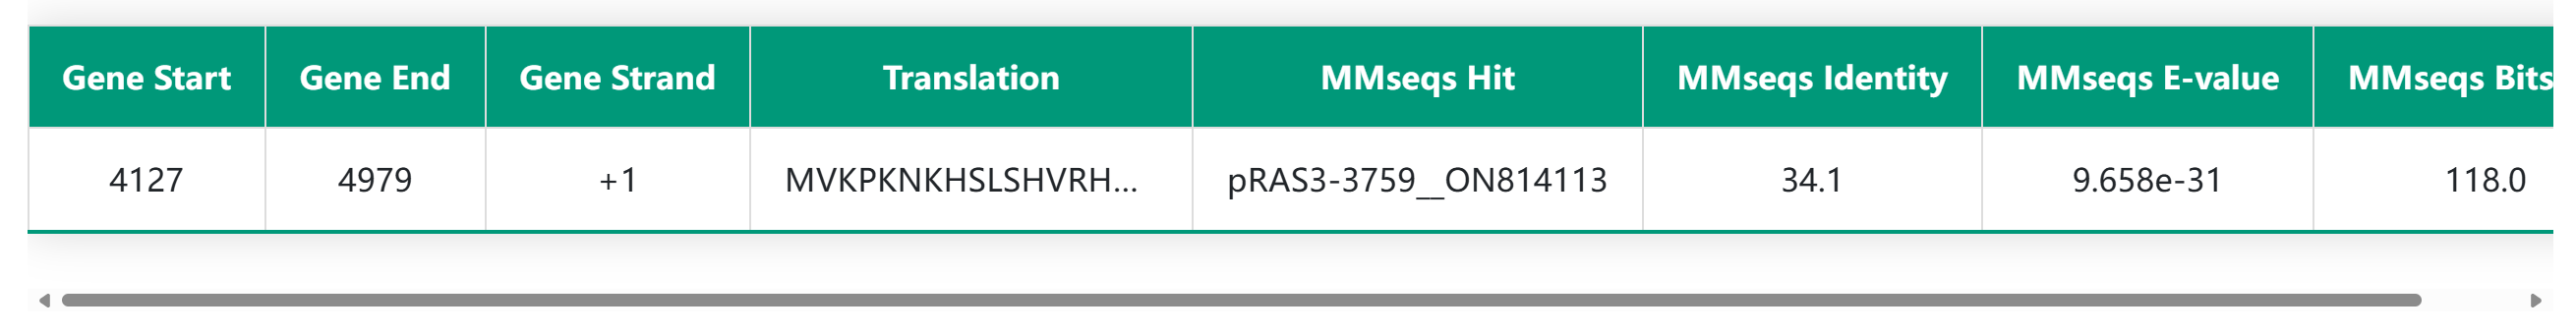
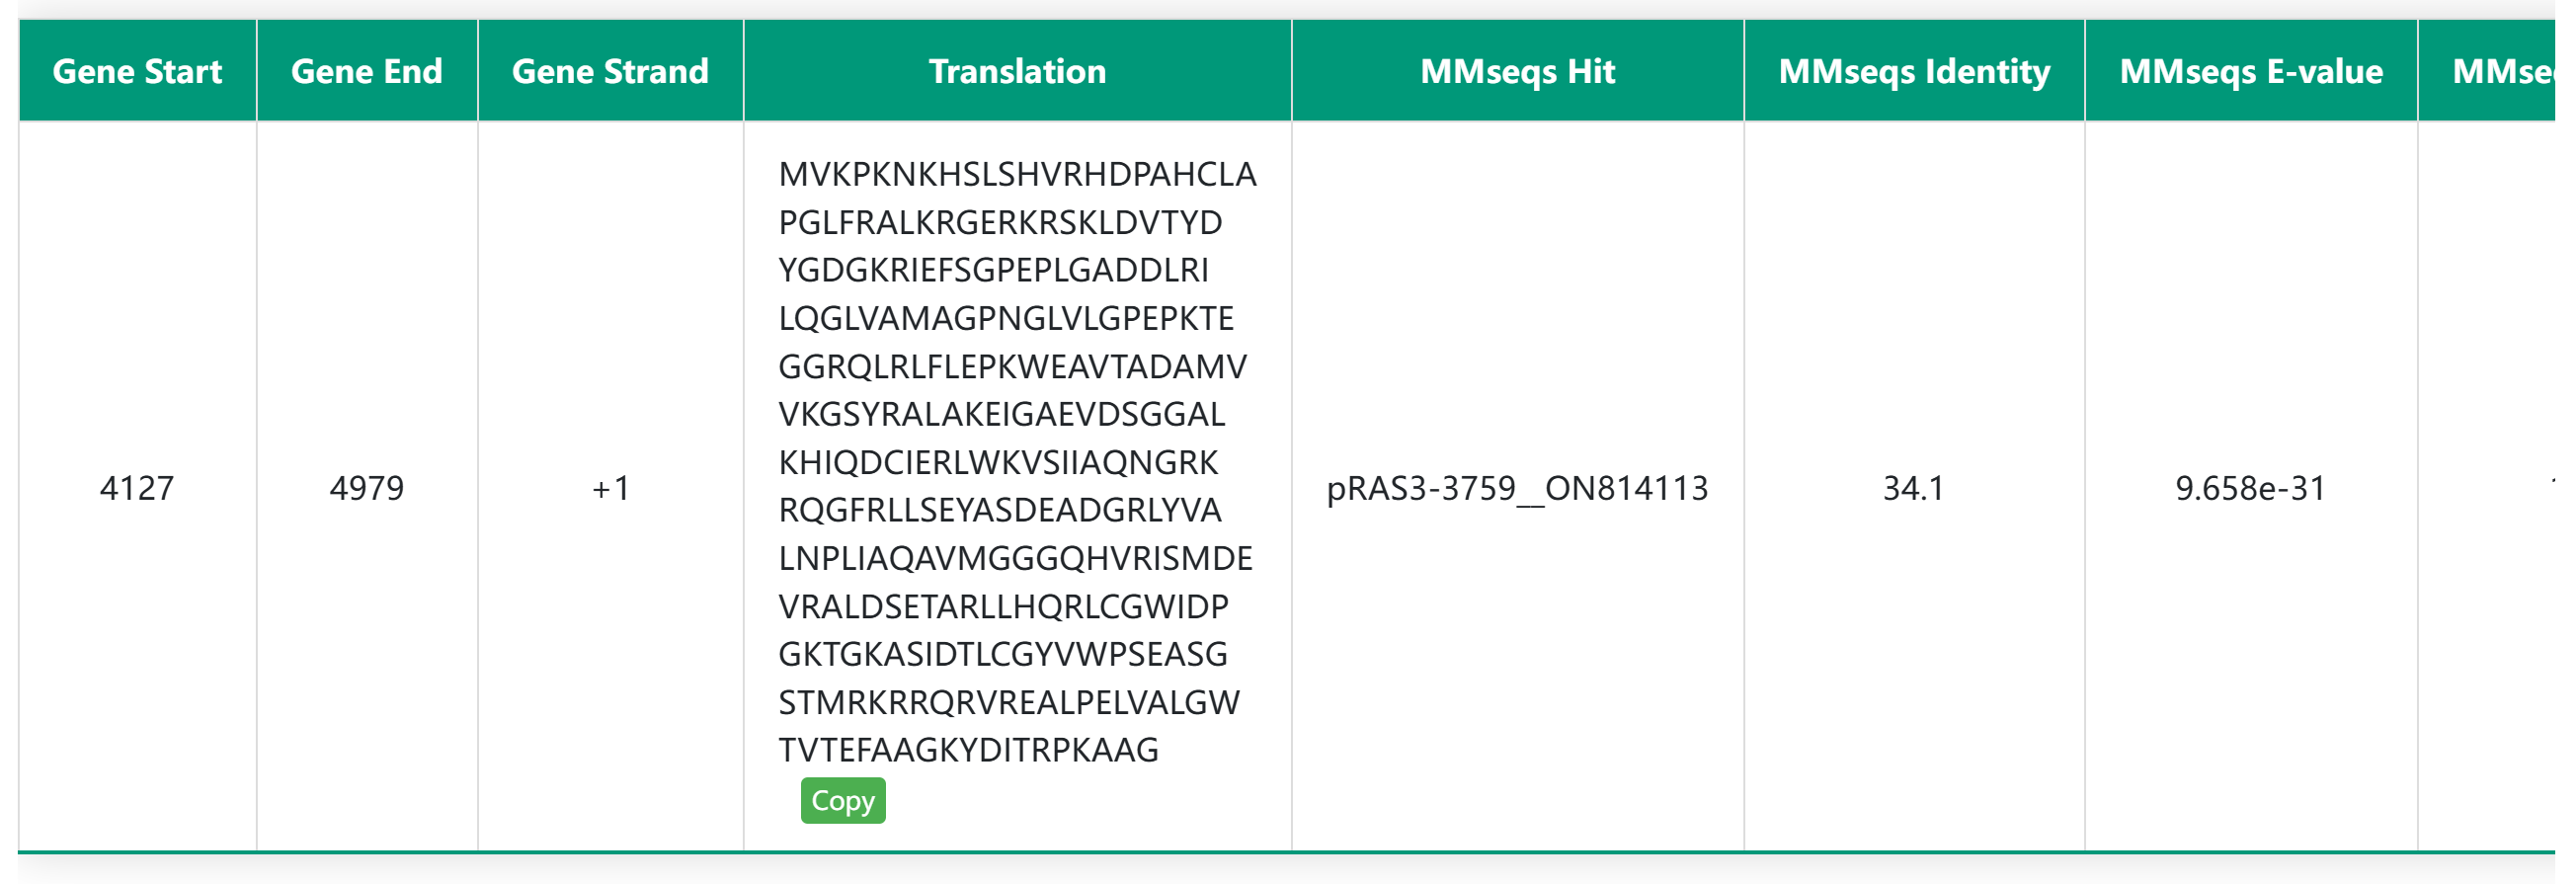
3. Replication initiation protein information
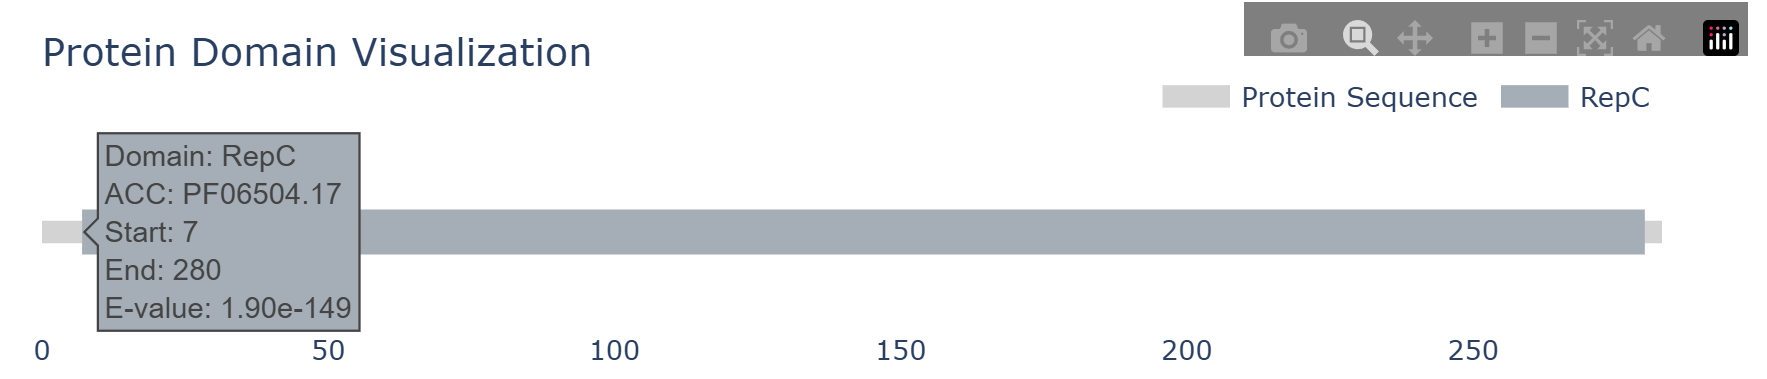
The detailed replication initiation protein information module includes the MMseq alignment results between the hypothetical replication initiation protein and the seed protein, as well as the conserved domain features of the replication origin protein. In the HTML table, users can click on amino acids to expand the full protein sequence and use the copy button to easily copy the protein sequence for further analysis. In the domain visualization section, hovering the mouse over a specific domain will display detailed information about that domain.
MMseq Alignment Results
Conserved Domain Features
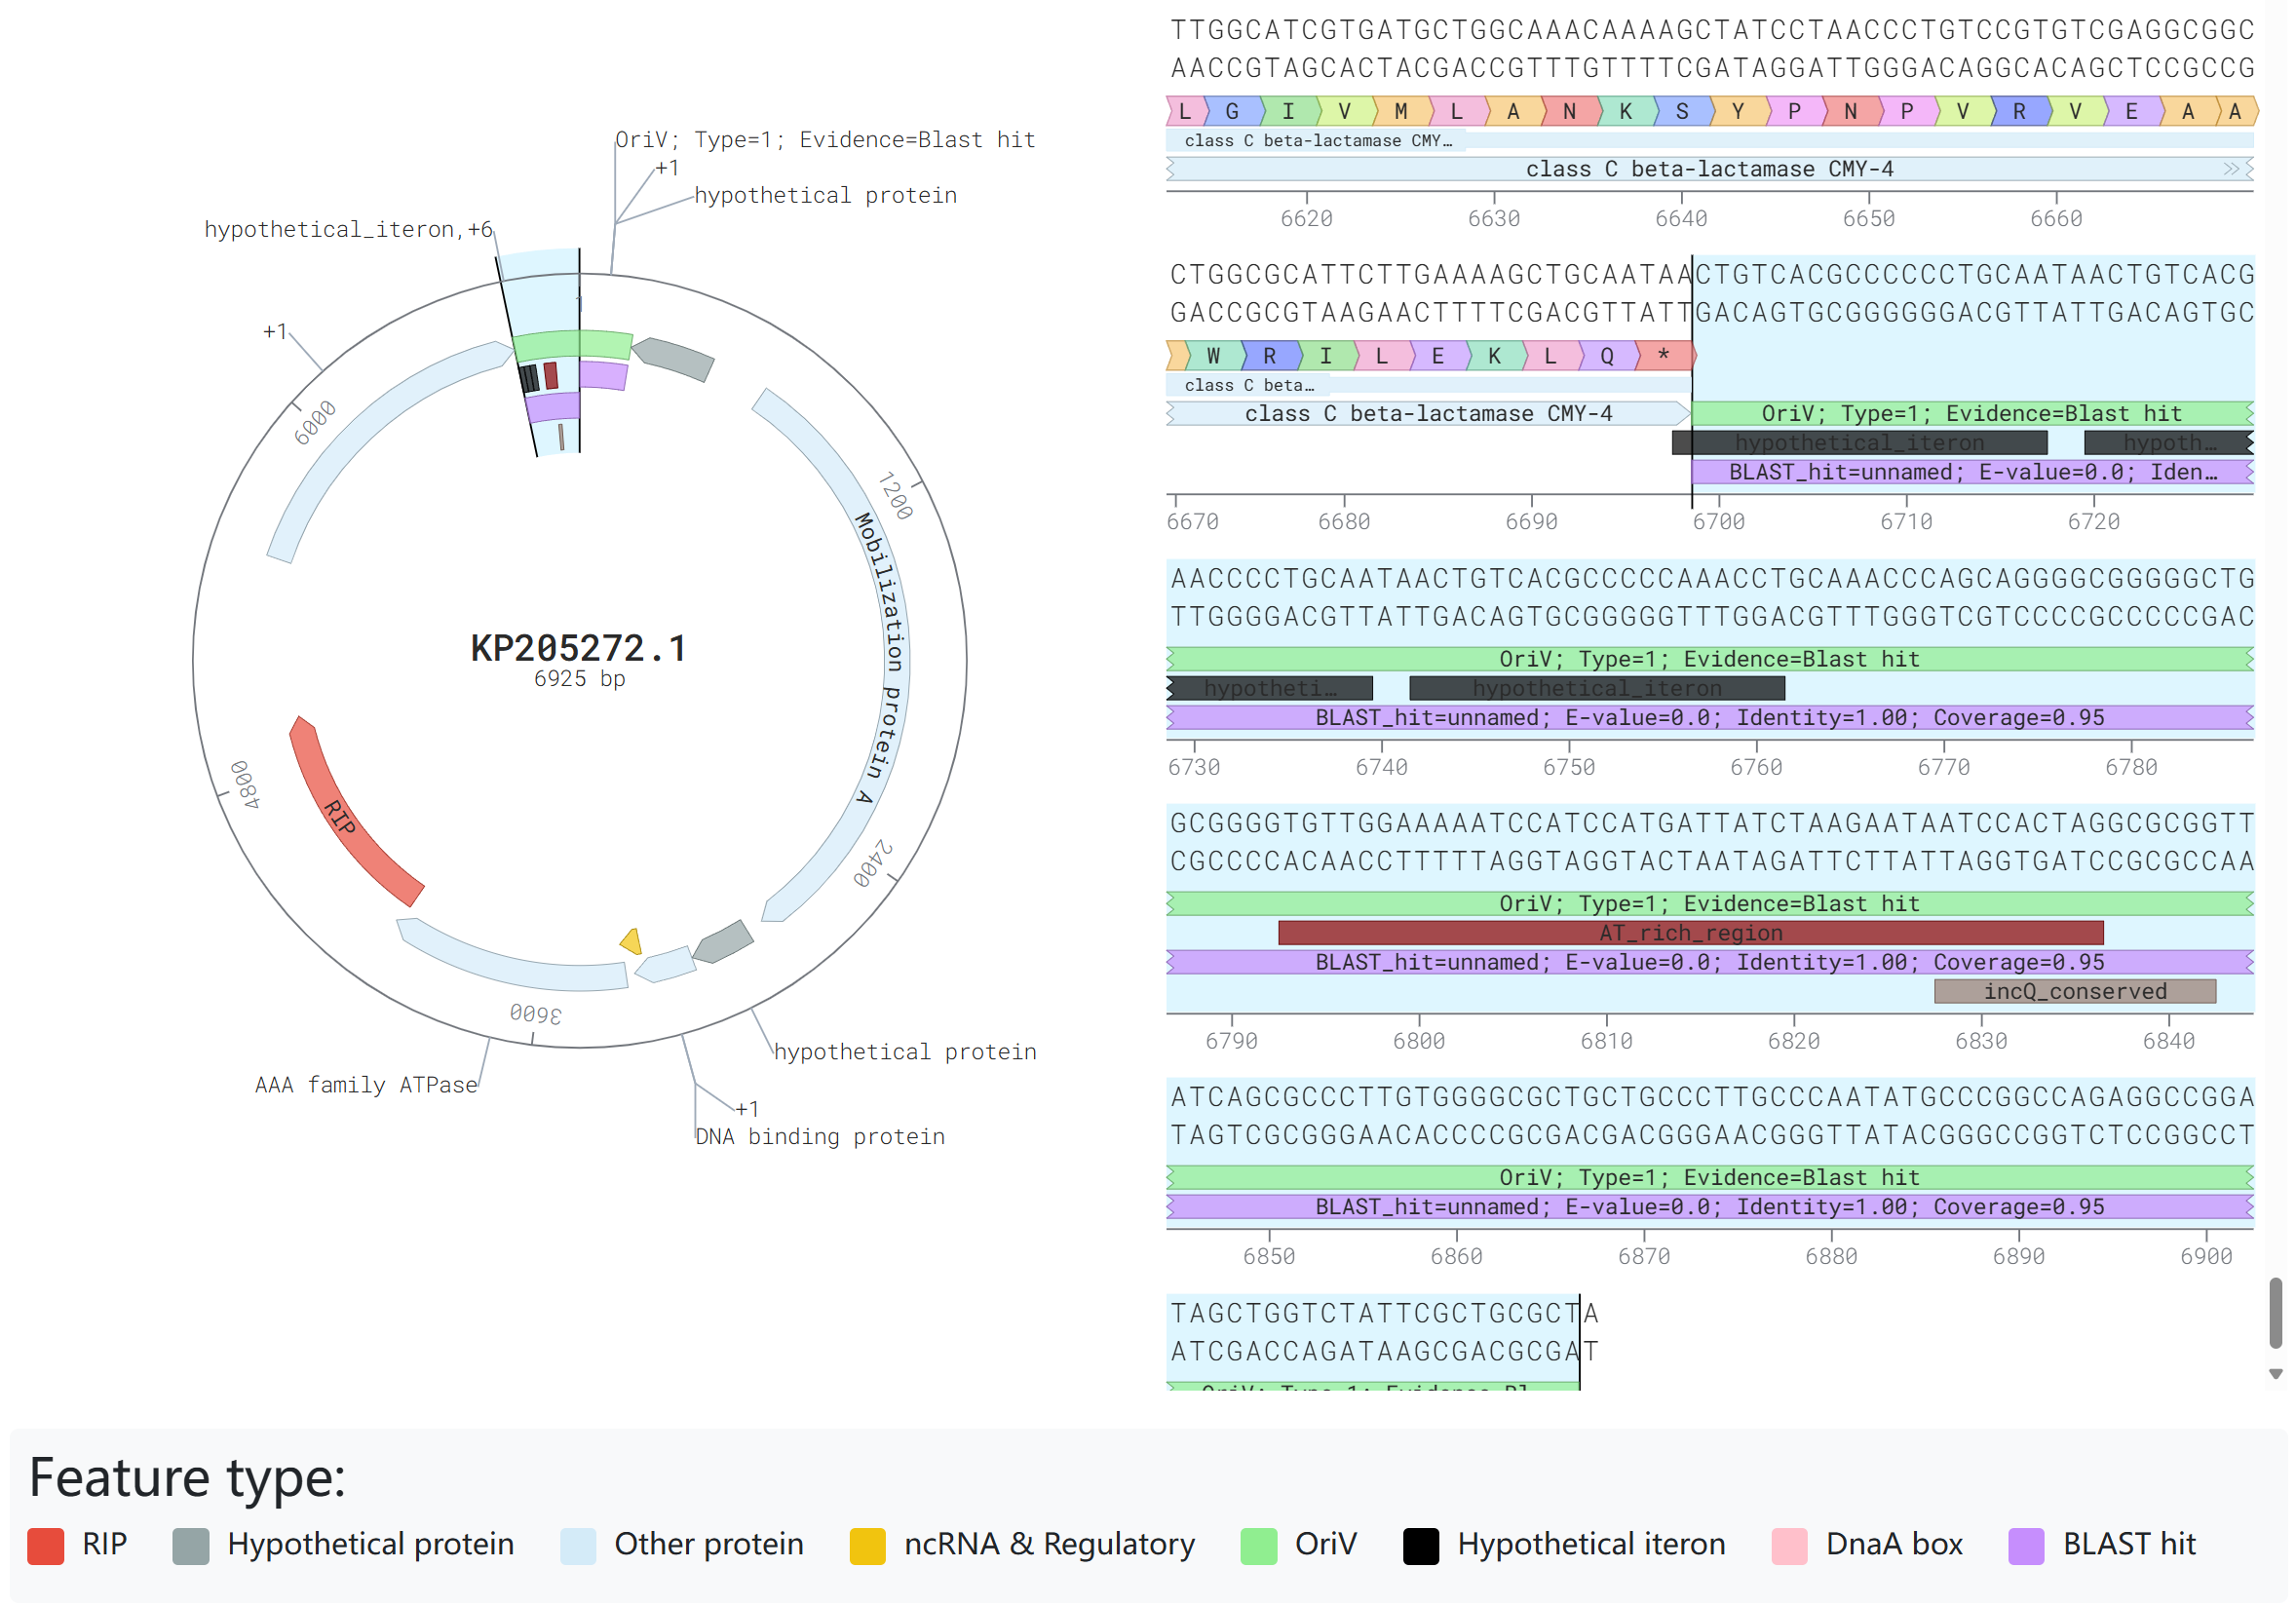
4. Integrated SeqViz
This module visualizes plasmid in both circular and linear formats. RIP proteins are marked in red, OriV in green, hypothetical proteins in gray, Other CDS in blue, and ncRNA & Regulatory RNA in yellow. Users can easily view the distribution characteristics of replication origin proteins and replication origins. Additionally, the replication origin section provides detailed annotations of potential iterons, DnaA Boxes, AT-rich regions, and conserved site information related to the replication origins of different plasmid types. Users can simply select a sequence and press CTRL+C (Windows) to copy the corresponding sequence for further analysis.