Tutorial
- Each record in DoriC are usually presented through two pages: the primary page and the secondary page.
- The primary page presents the basic information of the genome and the simple predicted results. Click the link of the replication origin in the primary page, the website will jump to the secondary page which presents the detailed information of the replication origin.
- There may be multiple possible replication origins in a genome. Each replication origin links to its own secondary page.
- The predicted results are explained in detail below.
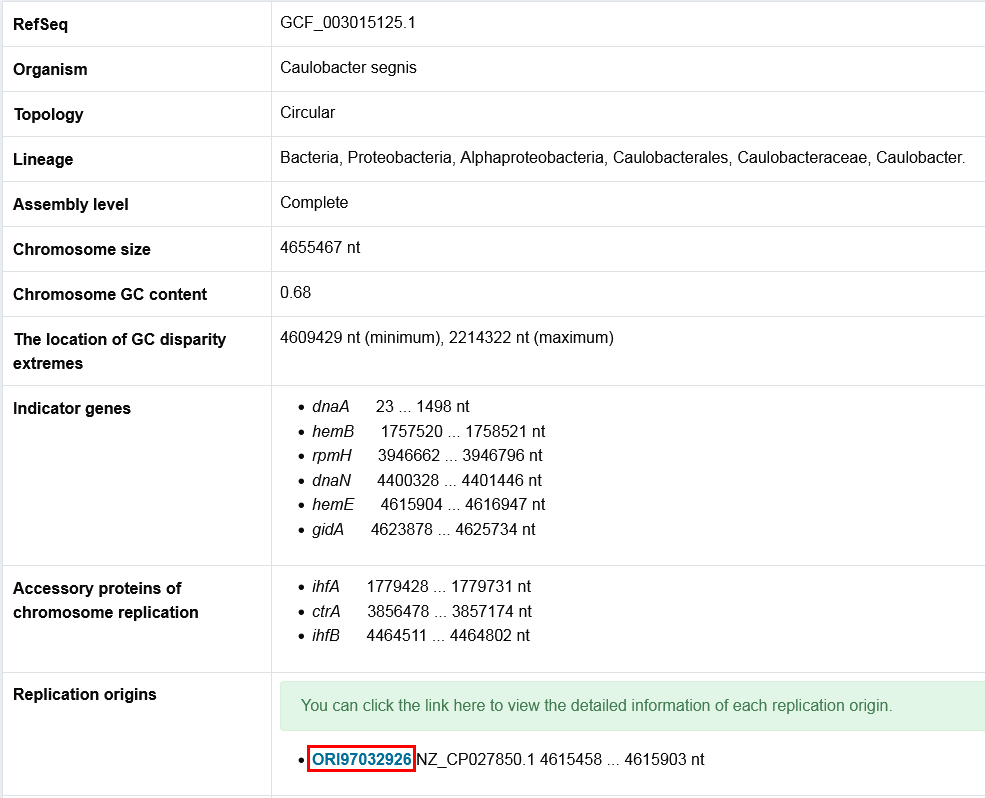
The primary page : The HTML table
- The HTML table provides the basic information of the genome and the simple predicted results. Click the link marked in red box, the website will jump to the secondary page which presents the detailed information of the replication origin.
- Some regulatory protein are annotated here.
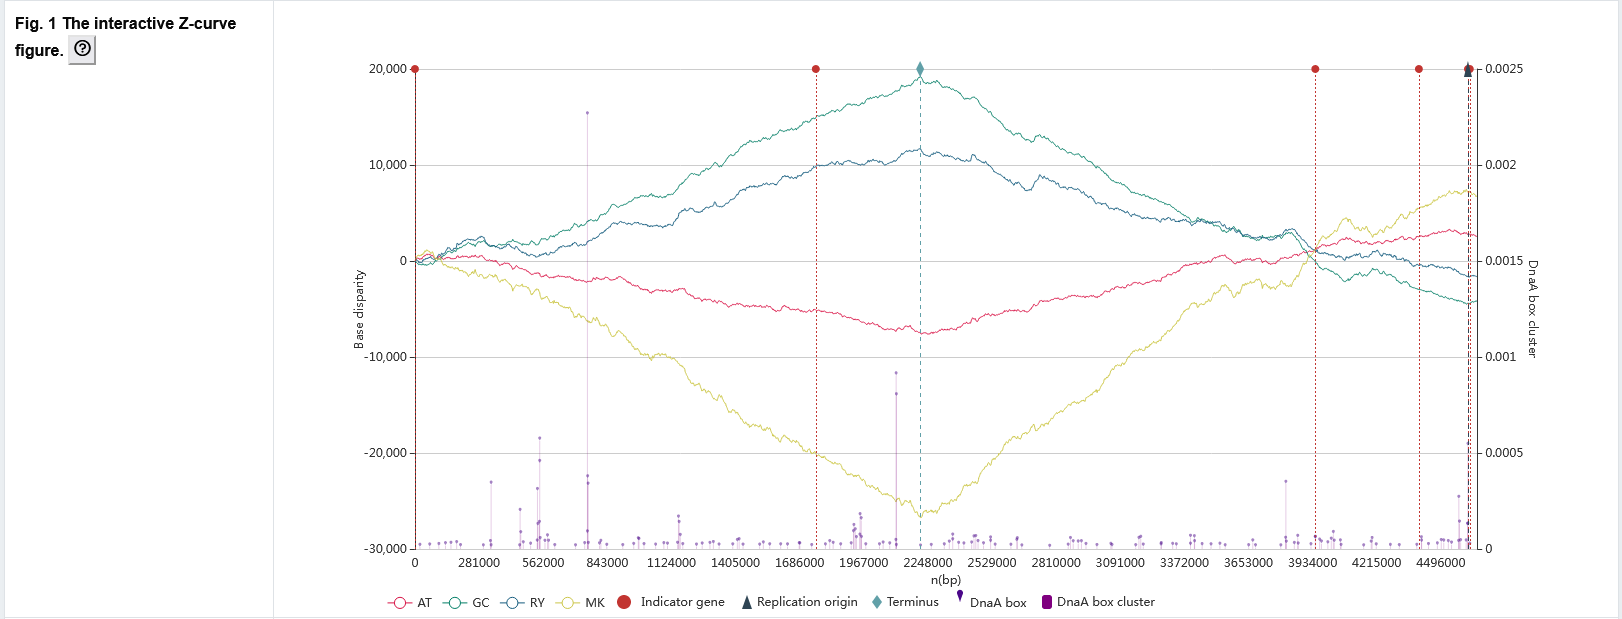
The primary page : Figure 1
The Z-curve graph with oriC related information.
- The red, green, blue, and yellow line graphs indicate the AT, GC, RY, and MK disparity curves, respectively, calculated according to the Z-curve method.
- Paweł Mackiewicz et al. [Paweł Mackiewicz et al., Nucleic Acids Res., 2004] proposed b value to measure the density of the DnaA box distribution. For each DnaA box, b = 1/d, d is a sum of the distances of the given DnaA box to its two adjacent DnaA boxes. A high value of b indicating a cluster of three boxes. The DnaA box corresponds to a purple dot graph. Each dot represents a DnaA box, the x-coordinate represents its position on the genome, and the y-coordinate represents its b value. The DnaA box cluster corresponds to a purple bar graph, which shows the maximum b value of DnaA boxes at the interval of genome position.
- Red, dark blue, and light blue dotted lines indicate locations of the indicator genes, oriCs, and replication terminus, respectively. When users hover the cursor over the dotted lines marking predicted oriCs, indicator genes or replication terminus, the exact locations and other related information are automatically displayed.
- Users can zoom the figure by sliding the mouse wheel or select specific datasets of interest for observation by clicking on the legend below.
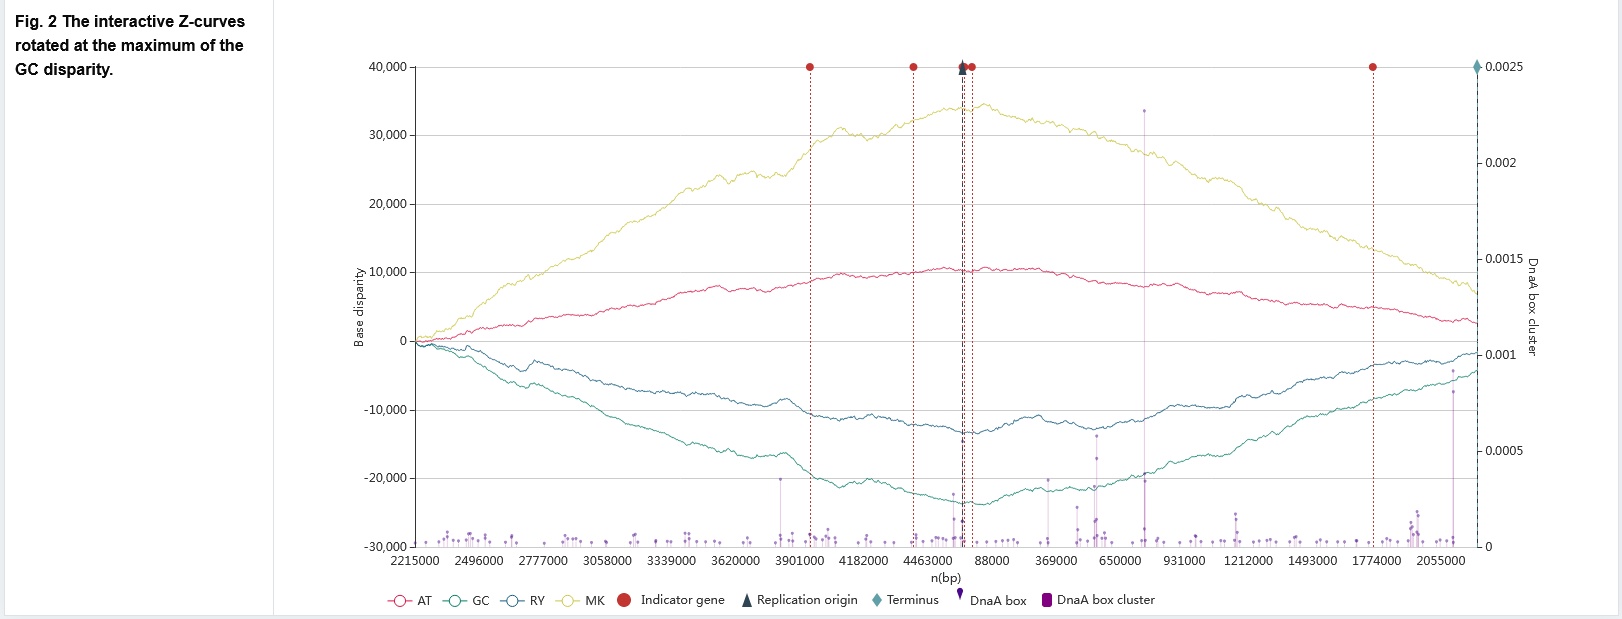
The primary page : Figure 2
The Z-curve graph rotated at the maximum of the GC disparity curve.
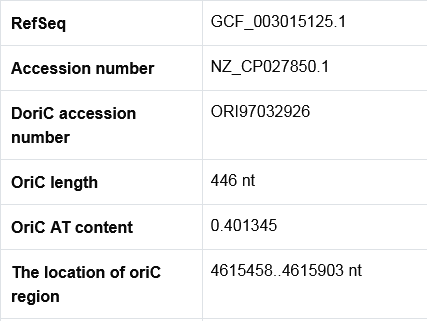
The secondary page : The HTML table
The HTML table provides some simple information of the oriC.
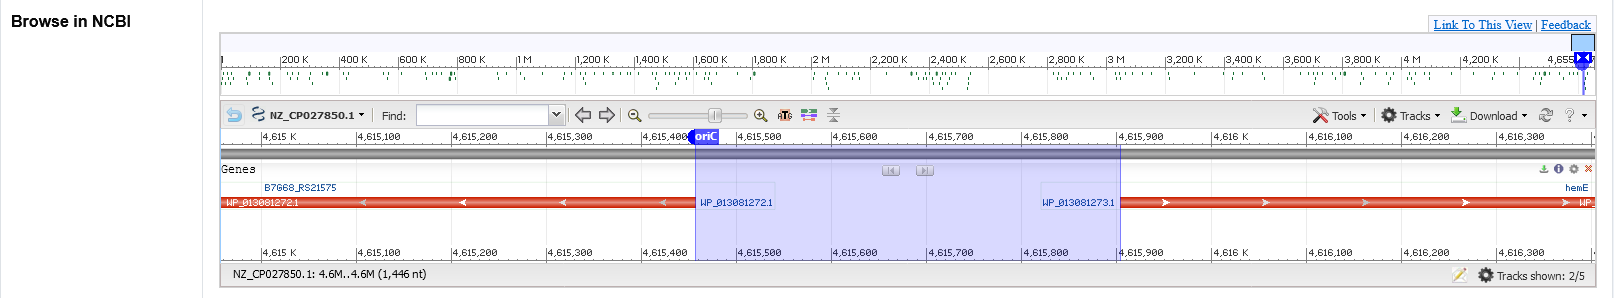
The secondary page : Browse in NCBI
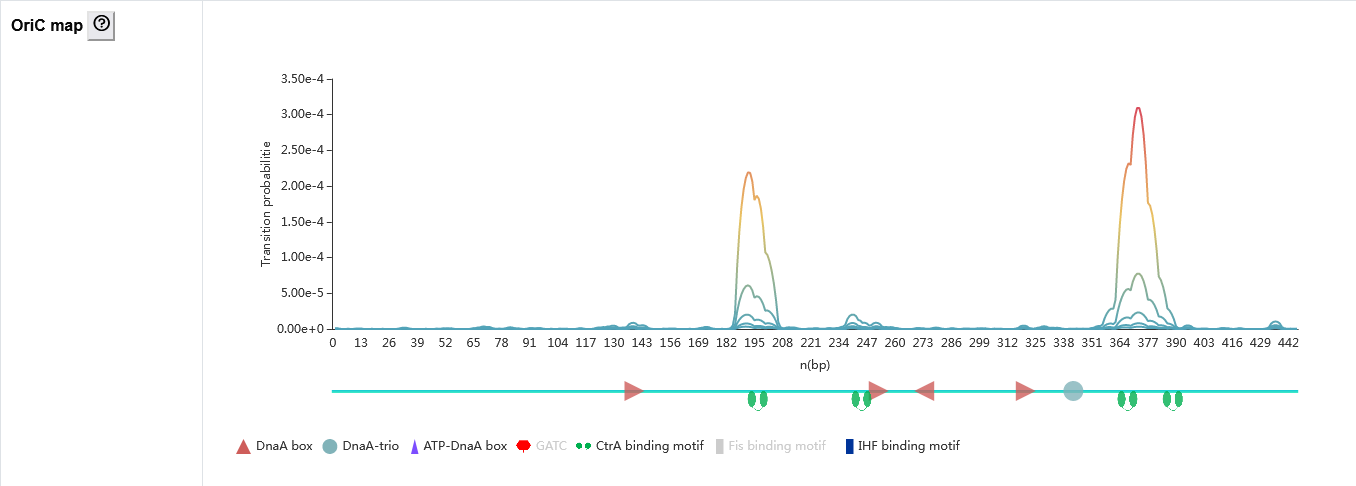
The secondary page : Oric map
The oric map contains two parts.
- The line graph shows the transition probability of each base pair in the oriC sequence calculated using Stress-Induced Duplex Destabilization method that analyzes stress-driven DNA strand separation. Five lines with gradient colors were calculated using different negative superhelicity values. The region with high transition probabilities is susceptible to melting. Therefor, the peaks may correspond to the AT-rich sequence that might serve as a DUE.
- The oriC sequence schematic diagram showing the distribution of functional elements, such as DnaA box, DnaA-trio, ATP-DnaA box, and binding sites of SeqA, CtrA, Fis, and IHF found in the predicted oriC.
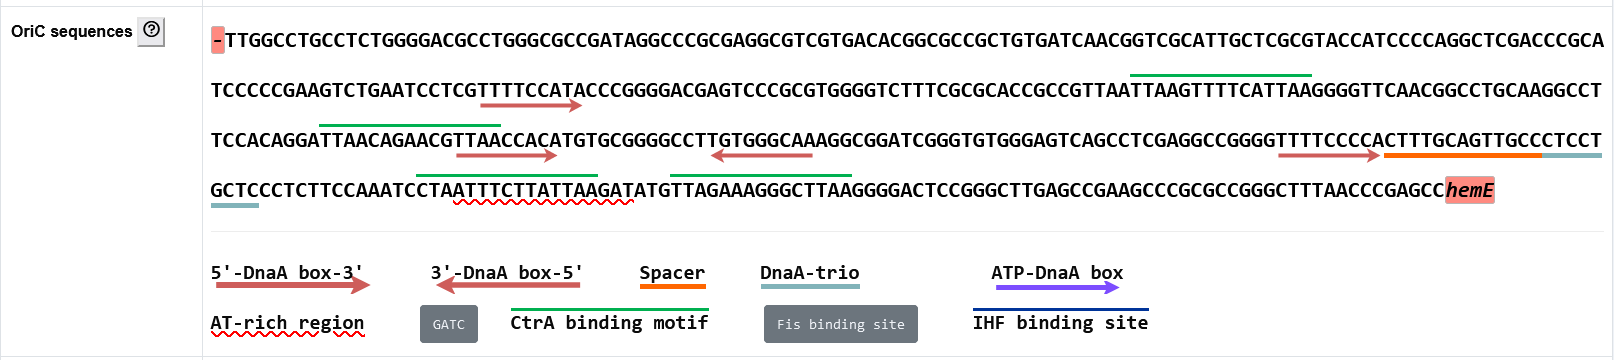
The secondary page : Oric sequence
- The functional elements are labeled with different colors or symbols in the oriC sequence.
- Indicator genes upstream and downstream of the predicted oriC are also labeled.
- In order to display the possible functional elements as comprehensively as possible, all possible DnaA-trios are labeled, and a less conserved DnaA box with ≤ 4 mismatches from the standard DnaA box motif adjacent to potential DnaA-trios will also be labeled, although its mismatch might be more than that entered by users.
- To facilitate potential new discoveries, all possible functional elements have been searched for within the oriCs recorded in DoriC 12.0. However, it should be noted that the predicted binding motifs may not always be functional as real binding sites, since many of these are restricted to specific lineages (e.g., Fis, IHF, and CtrA binding sites are usually found in a subset of proteobacteria) and are not present throughout the bacterial domain (same GATC methylation sites). The default display of these sites is also set according to the lineage of species. Additionally, the characteristic visualization of oriC sequences is interactive, and users can select functional elements for observation by clicking corresponding buttons.
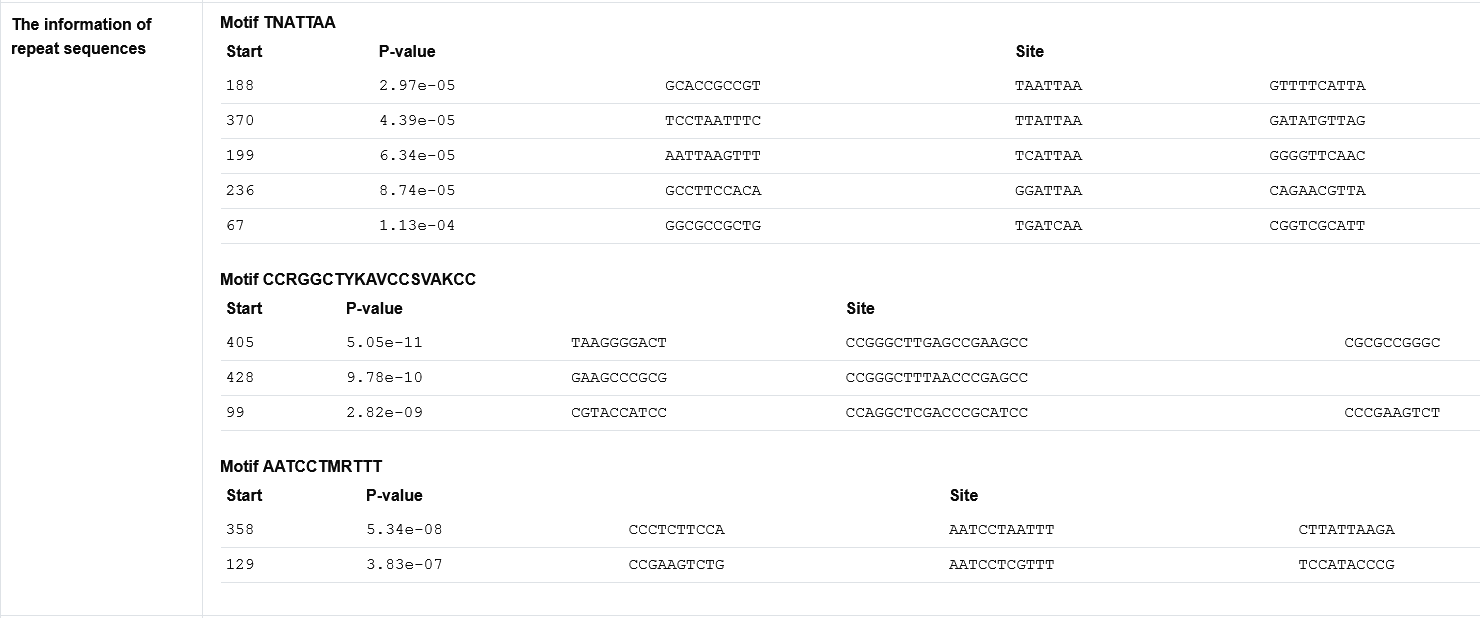
The secondary page : Repeat sequences discovery in oriCs by MEME
In order to reveal possible new motifs, the repeat sequences in predicted oriCs are discovered by MEME.
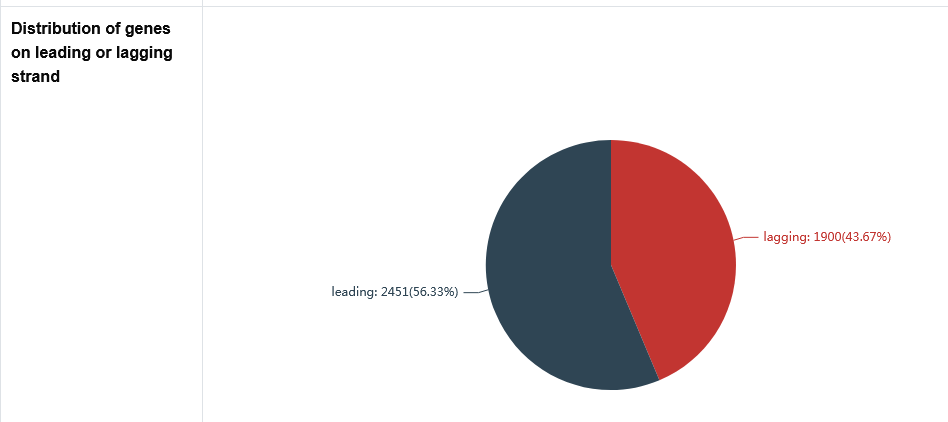
The secondary page : The distribution of genes on leading or lagging strand
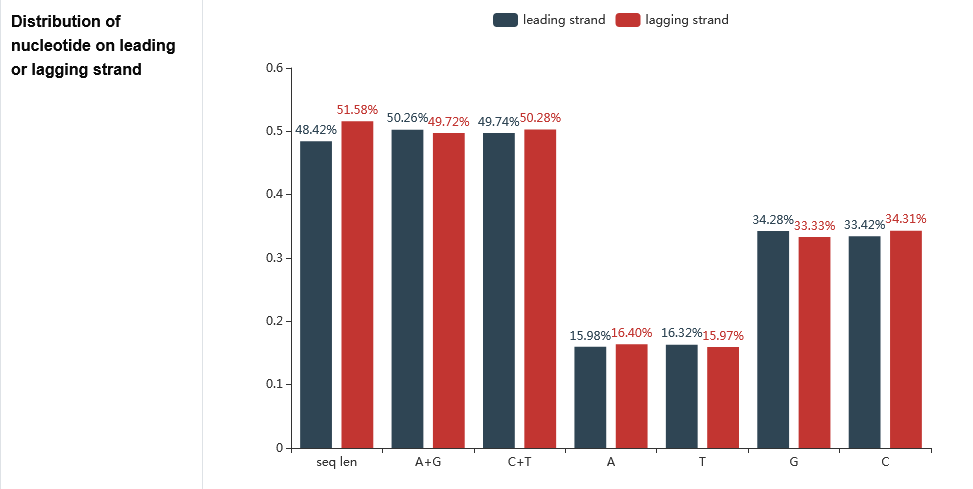
The secondary page : The distribution of base composition on leading or lagging strand
The Adenine (A), Thymine (T), Guanine (G), Cytosine (C), Purine (A+G) and Pyrimidine (C+T) content as well as sequence length of the leading strand and lagging strand are counted here.
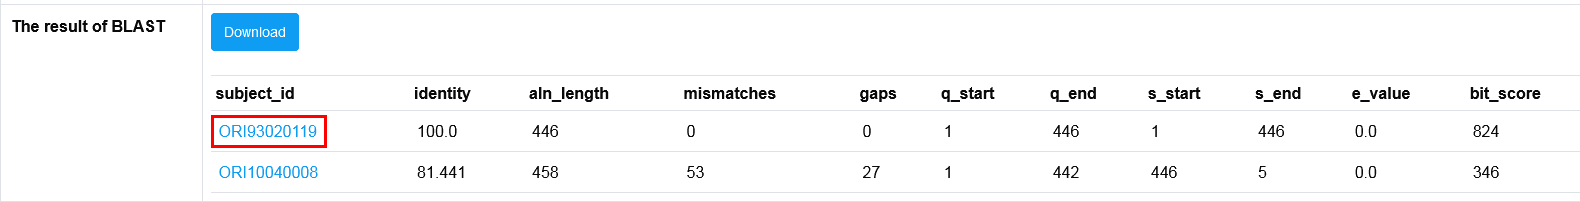
The secondary page : Homologous oriC sequences search with BLAST
The homologous sequences to predicted oriCs are searched by BLAST against the DoriC database, and the BLAST results linking to the corresponding entry in the DoriC database are also provided.